실행환경
java : 21
springboot :3.2.4
Springboot 설정
build.gradle
dependencies {
	...
	implementation 'org.springframework.boot:spring-boot-starter-actuator'
	runtimeOnly 'io.micrometer:micrometer-registry-prometheus'
	...
}
위의 두개 추가
application.yml
management:
  endpoint:
    metrics:
      enabled: true
    prometheus:
      enabled: true
  endpoints:
    web:
      exposure:
        include: "*"
  metrics:
    tags:
      application: async-monitor
management.endpoints.web.exposure.include: "*" 은 모든 엔드포인트를 열어놓는것이므로 보안에 취약하다 구글에 찾아보면 많은 정보가 있기때문에 필요한것만 열도록 하자
management.metrics.tags.application: async-monitor는 나중에 prometheus설정에서도 똑같이 입력해야 grafana에서 정상적으로 나오기때문에 반드시 기억하자!
Springboot 실행후
http://localhost:8080/actuator/prometheus위의 url을 입력해서 잘 나오는지 확인!
Prometheus 설정
prometheus.yml
global:
  scrape_interval: 10s # 10초마다 매트릭을 수집 default 1분
  evaluation_interval: 1m # 1분마다 규칙을 평가 default 1분
  external_labels: # 외부 시스템에 표시할 이 서버의 레이블
    monitor: 'async'
rule_files: # 규칙을 로딩하고 evaluation_interval 설정에 따라 정기적으로 평가한다.
# - "first.rules"
# - "second.rules"
scrape_configs:
  #- job_name: 'prometheus'
  #  static_configs:
  #    - targets: ['localhost:9090']
  - job_name: 'async-monitor' # 잡 이름
    metrics_path: '/actuator/prometheus' # 메트릭을 수집할 path 설정
    static_configs:
      - targets: ['host.docker.internal:8080'] # 도커 인스턴스 내부 호스트:8080
scrape_configs:job_name: 'async-monitor' 의 이름은 위에 Springboot 설정시
'management.metrics.tags.application: async-monitor' 이름과 동일하게 해야한다.
도커 컴포즈 yml
docker-compose.yml
version: '3'

services:
  prometheus:
    image: prom/prometheus:latest
    container_name: prometheus
    ports:
      - "9090:9090"
    volumes:
       - ./prometheus.yml:/etc/prometheus/prometheus.yml
    extra_hosts:
       - host.docker.internal:host-gateway

# 추가
  grafana:
    image: grafana/grafana:latest
    container_name: grafana
    user: "$UID:$GID"
    ports:
      - "3000:3000"
    volumes:
      - ./grafana-data:/var/lib/grafana
    depends_on:
      - prometheus
prometheus.yml vloumes은 만들어놓은 위치에 만들어 놓고 실행해야한다.
grafana volumes는 현재 cmd에서 실행한 위치에 /grafana-data 폴더가 생성된다.
위의 docker-compose.yml을 아래 명령어로 실행
- docker compose up -d
주의!
volumes를 꼭 설정하자!!
도커 컨테이너가 내려가도 Grafana, Promethues에서 설정한 대시보드나 데이터 소스가 사라지지 않도록 해야한다
Prometheus 실행 확인
http://localhost:9090/위의 url을 입력하여 들어간다

위와같은 창이 나오면 성공!
그리고 상위 메뉴중 Status > Targets에 들어간다
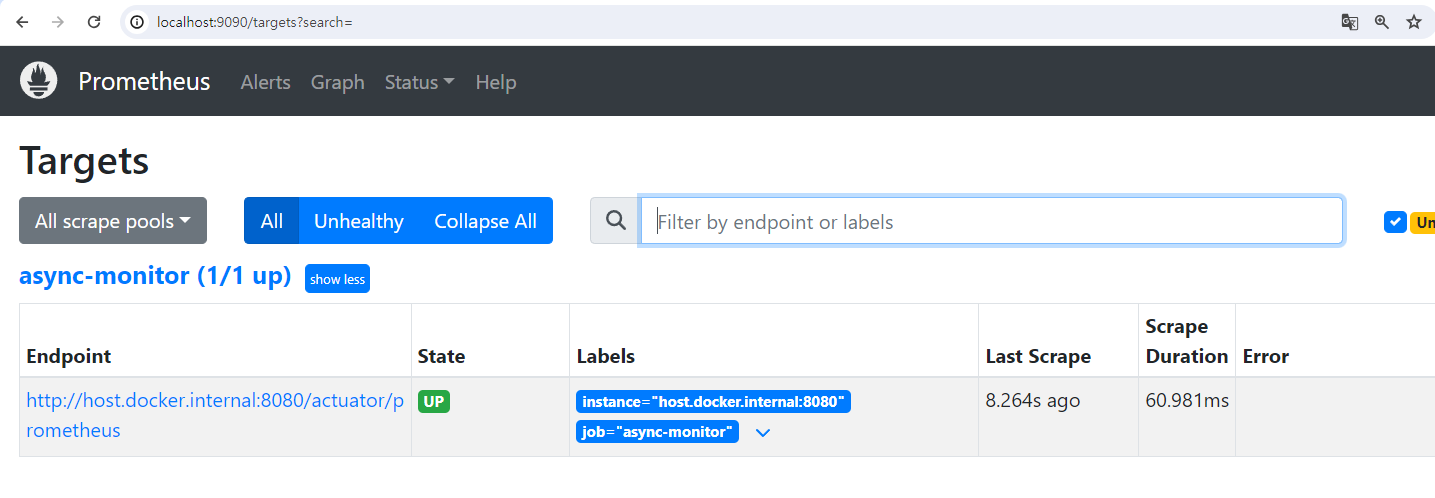
위와같이 prometheus.yml에 설정해놓은 타겟이 state = up 이면 정상적으로 springboot에서 정보를 가져오게된다.
Grafana 실행 확인
http://localhost:3000위의 url에 접속한다.

위의 페이지가 나온다면 성공!
ID : admin
PW : admin
입력!
Grafana - Prometheus 연동

grafana 로그인후 Connections > Data sources에 진입
Add new data Source 입력

Prometheus 클릭
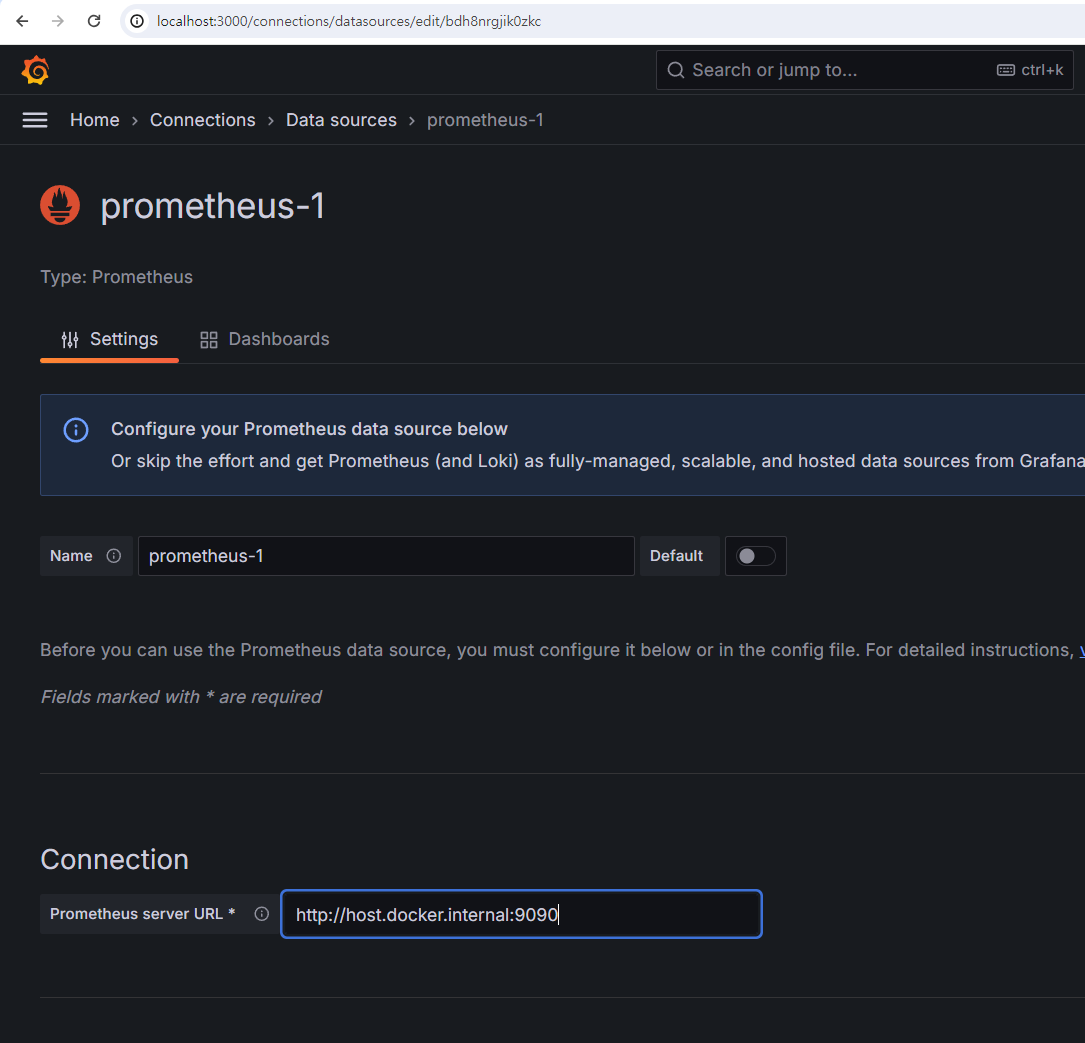
prometheus server URL : http://host.docker.internal:9090
반드시 host.docker.internal 로 설정해야 테스트 접속시 정상 연결이 된다.
prometheus가 docker에서 실행되고 있기때문에 위의 url로 접속해야지 네트워크가 정상적으로 prometheus의 docker로 연결해준다.
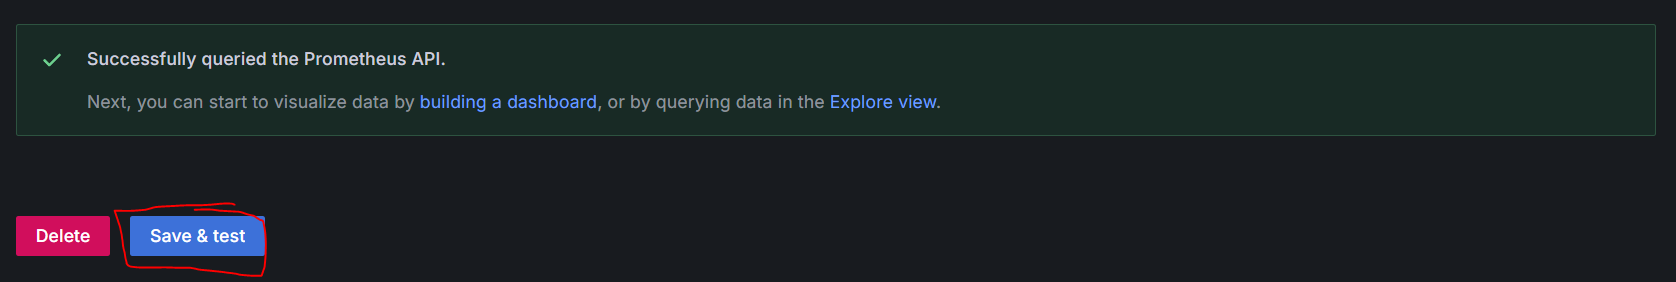
save & test 클릭했을때 위에 successfully ~ 가 나오면 정상적으로 연결 완료!
Grafana Dash board 생성하기
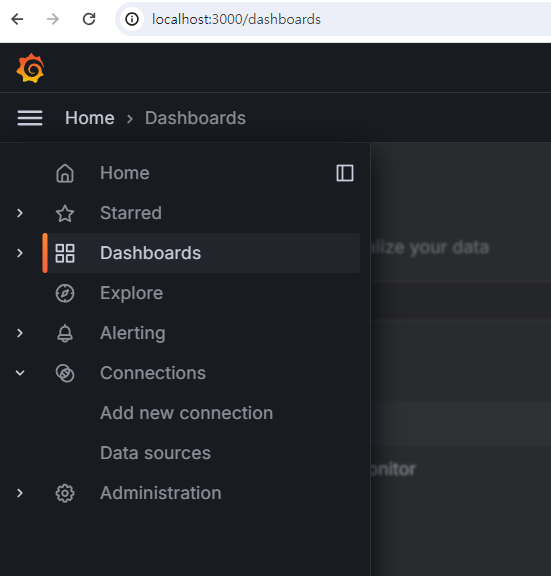
왼쪽 메뉴중 Dashboards 클릭
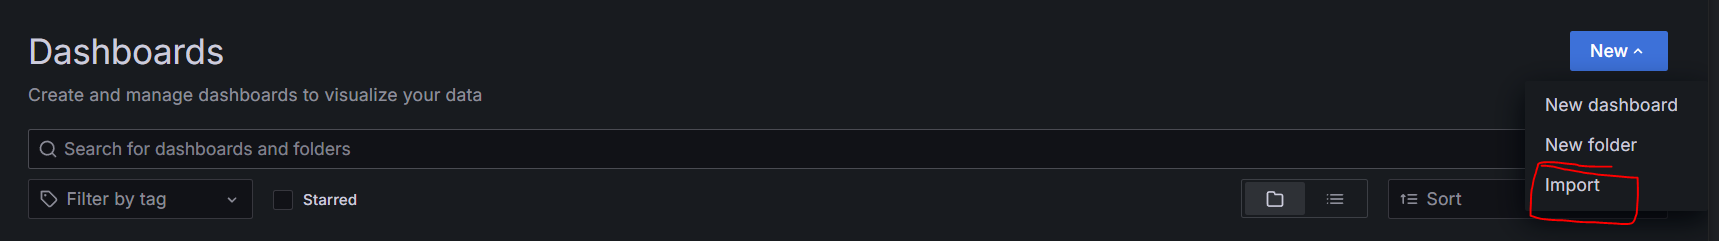
New > import 클릭
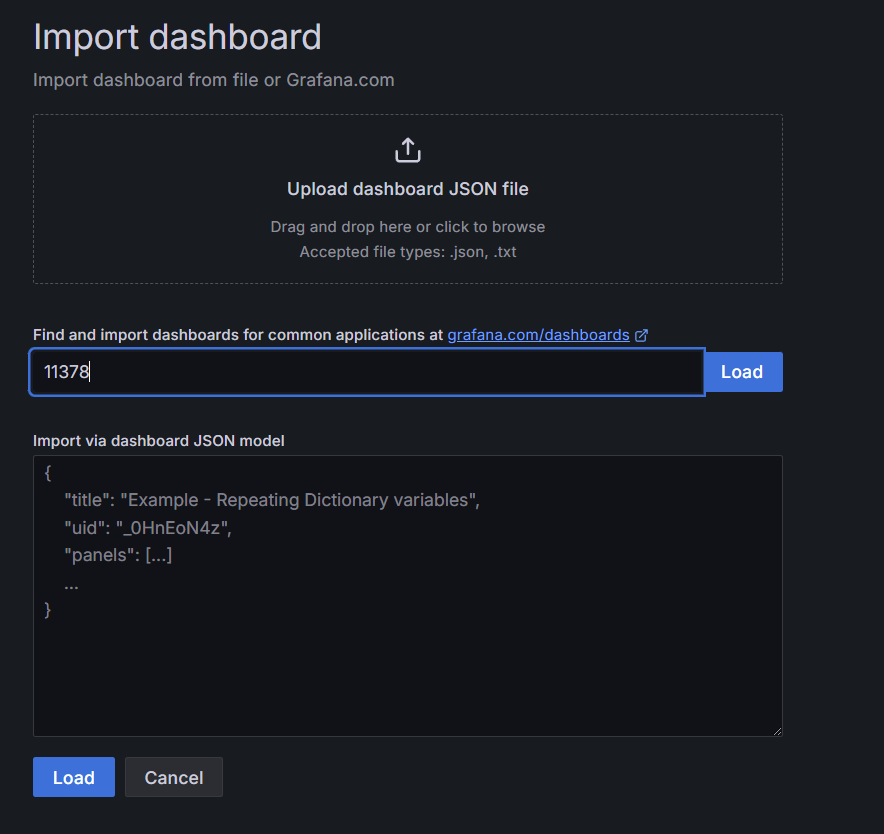
필자는 11378 사용하였다.
더많은 대쉬보드는 https://grafana.com/grafana/dashboards/ 에서 확인할 수 있다.

위와같이 대쉬보드가 생성되고 빨간색 네모와 같이 Springboot설정시 yml 설정할때
management.metrics.tags.application: async-monitor 이름이 나오게 된다.
'Docker' 카테고리의 다른 글
| VueJs Docker를 이용해서 node 20.12.2 버전 빌드하기(with jenkins,ssh) (0) | 2024.05.07 |
|---|---|
| Grafana에서 PostgreSql 모니터링 하기(postgresql_exporter연동) (0) | 2024.04.28 |
| Docker 명령어 (0) | 2024.02.09 |
| nGrinder 성능 테스트 툴 (0) | 2024.01.25 |
| Redis Sentinel Docker Compose yml (0) | 2024.01.25 |